


MSC 2019-L2 - Credit Enhancement Projections
Measuring the impact of amortization, defaults, losses and recoveries.

CMBS Research reviewed remittance data for MSC 2019-L2 to anticipate changes in credit enhancement given scheduled amortization, payoffs and anticipated liquidations over the next 48 months. The analysis incorporated expected principal paydown based on individual amortization schedules for each of the loans. Principal payments were not modeled for delinquent or specially serviced loans as well as loans that defaulted under various stressed scenarios. For the purpose of this analysis, delinquent loans are defined as those over 60 days past due in principal payments.
Also included in the analysis are projected losses and recoveries (inclusive of fees and workout costs) on distressed loans based on proprietary opinions of value for the collateral properties. Expected default and liquidation timing for these distressed loans were modeled into the cash flow analysis. Distressed loans are those that are delinquent, specially serviced, or expected to default under various stressed scenarios as noted above.
Below is the credit enhancement snapshot displaying the results of our analysis.

As is typical for most CMBS conduit transactions as they season, there is a positive spread in credit enhancement at the top of the liability structure when compared to issuance levels. The spread tightens and inverts toward the bottom of the structure based primarily on realized and projected losses/recoveries on distressed assets.
Credit enhancement for the top tranches down to class C is expected to remain above issuance levels based on our analysis. Class D credit enhancement is expected to fall below issuance over the next 12 months, but will recover and eventually climb above the original level.
Projected losses are expected to cause credit enhancement to fall and remain below issuance for classes E through G. Although credit enhancement will weaken for these classes, CMBS Research expects principal losses to impact only class H.
All data used in this analysis and displayed herein is courtesy of Deal Charts. Please click here for the most up-to-date data for this transaction.


Updated maturity distribution data available here, courtesy of Deal Charts

Updated interest rate data available here, courtesy of Deal Charts

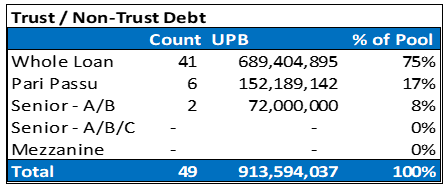
Updated total debt data available here, courtesy of Deal Charts


Logo and banner courtesy of elc.designs.elc@gmail.com